
⏱ LAST UPDATED: October 2026 | RTX 50 SERIES & RYZEN 9000 SUPPORTED
PC Bottleneck Calculator
Analyze your CPU & GPU pairing with precision
PROCESSOR BRAND
GRAPHICS CARD BRAND
SYSTEM SETTINGS
ANALYSIS RESULT
CPU SPECS
GPU SPECS
COMPONENT COMPARISON
CPU #1
CPU #2
GPU #1
GPU #2
FIND OPTIMAL COMPONENT MATCH
YOUR GPU
YOUR CPU
ANALYSIS HISTORY
PC Bottleneck Calculator
Check your CPU & GPU balance instantly
Estimates based on relative hardware performance scores. Real-world results vary by game and drivers.
Did the Calculator Help You?
Use our Advanced PC Bottleneck Calculator for reliable results. Beyond basic inputs like CPU, GPU, RAM, and resolution, our tool also considers effects of other advanced factors such as ray tracing, DLSS/FSR, background load, cooling, FPS, and detail level to give performance predictions and possible bottlenecks for different games.
Additionally, you can compare two CPU vs GPU to upgrade your system, and find the optimal component match, the perfect GPU for your CPU, or the ideal CPU for your GPU to fix the identified bottleneck in your system to build a balanced gaming PC.
"If you are a serious gamer, designer, video editor, or streamer, use our Advanced PC Bottleneck Calculator with DLSS, ray tracing bottleneck checker to reliably find out what’s holding your system back."
Budget Build Comparison Table
Popular CPU + GPU combinations with estimated bottleneck percentages for every budget
| CPU | GPU | RAM | Resolution | Bottleneck | Best For |
|---|---|---|---|---|---|
| Ryzen 5 5600 | RX 6600 | 16GB DDR4 | 1080p | 4 to 6% | Fortnite, CS2, Apex |
| Core i3-14100F | RTX 5060 | 16GB DDR5 | 1080p | 3 to 5% | Budget 1080p gaming |
| Ryzen 5 7600 | RX 9060 XT 16GB | 16GB DDR5 | 1080p | 2 to 4% | Best budget 2026 |
| CPU | GPU | RAM | Resolution | Bottleneck | Best For |
|---|---|---|---|---|---|
| Ryzen 5 7600 | RX 7700 XT | 32GB DDR5 | 1440p | 3 to 5% | Best value 1440p |
| Core i5-13600K | RTX 5060 Ti | 32GB DDR5 | 1440p | 4 to 6% | Intel 1440p sweet spot |
| Ryzen 5 9600X | RX 9070 XT | 32GB DDR5 | 1440p | 2 to 4% | 1440p with ray tracing |
| CPU | GPU | RAM | Resolution | Bottleneck | Best For |
|---|---|---|---|---|---|
| Ryzen 7 9800X3D | RTX 5070 | 32GB DDR5 | 1440p / 4K | 2 to 4% | Best 1440p build 2026 |
| Core i7-14700K | RTX 5070 Ti | 32GB DDR5 | 4K | 2 to 3% | Intel 4K gaming |
| Ryzen 9 9950X3D | RTX 5080 | 32GB DDR5 | 4K | 1 to 3% | Future-proof 4K |
| CPU | GPU | RAM | Resolution | Bottleneck | Best For |
|---|---|---|---|---|---|
| Ryzen 9 9950X3D | RTX 5090 | 64GB DDR5 | 4K / 8K | 1 to 2% | Maximum performance |
| Core i9-14900KF | RTX 5090 | 64GB DDR5 | 4K | 2 to 3% | Intel enthusiast |
Why Our Full PC Calculator is a Game Changer
Let's explore our tool in detail. This calculator is a complete performance analyzer, having three powerful features that give you a full picture of your system.
1-The Calculator
This is the core feature of the tool. It analyzes your CPU, GPU, and other components like RAM, storage, cooling setup, background processes, ray tracing, DLSS/FSR, detail level, and even your target FPS. You’ll get an estimate of what’s really holding your rig back.
2. The Compare Component
Use this part if you want to upgrade your current system but can’t decide between two CPUs or GPUs. With this amazing feature of our calculator, you can compare their performances side by side to upgrade smartly instead of guessing.
3. The Find Match Tool
Once the bottleneck is detected, use this feature to fix it. It automatically finds a compatible CPU for your current GPU and vice versa for optimal performance. Whether you want to balance your current build or plan a new one, this feature saves you from costly mismatches.
Let me tell you an interesting story about why I came up with the idea of developing a tool of my own with all the features included. As a gamer, I had tried all the PC build bottleneck calculators available online, but I could never find the desired results. Each one of them was lacking somehow. Most calculators only focused on the CPU, GPU, and resolution, but their results were never practical enough to actually answer whether is bottleneck bad for pc for your specific setup.
That was the time I got a realization that my community of gamers needs a tool that deeply understands what is bottlenecking my PC and its performance-related issues, that can help in the real gaming world. So, after days of hard work, I was able to build this tool, Full PC Calculator, which works on everything that can make my performance better. For example, Storage issues, cooling temp, ray tracing, DLSS/FSR, and even target FPS.
So it's not just an ordinary tool, it's a gaming PC analyzer that has been built by keeping in mind all the possible problems that a gamer can face and their solutions. Moreover, we have added advanced CPU and GPU filters to help you narrow down your choices when you want to fix the detected bottleneck or build a balanced gaming PC within your budget.
Understanding What is a PC Bottleneck?
Picture an eight-lane motorway that suddenly drops to one lane at a tollbooth. The tollbooth controls the speed of every car behind it, no matter how fast the rest of the road is. That is exactly what happens inside your PC when one component cannot keep up with the others. The slowest part sets the pace for everything.
In a balanced system, your CPU, GPU, RAM and storage all work in rhythm. One component prepares the data, the next one processes it, the next one feeds it back. When one of these is too slow for the others, work piles up behind the slow part and your frame rate stalls.
The most common culprits are an underpowered CPU paired with a strong GPU, or the reverse. Thermal throttling makes the problem worse because an overheating chip slows itself down to cool off, creating a bottleneck where the hardware is technically capable but the temperatures will not allow it. You see the result as lower FPS, stuttering during action scenes, frame pacing issues that make a 60 FPS game feel choppy, and occasional audio crackles when the CPU runs out of headroom.
Common PC Bottleneck Types
Common PC Bottleneck Types
Not every bottleneck comes from the CPU or GPU. A slow drive, hot chip, weak power supply or even an old monitor can be the one component holding your rig back. Here are the seven types you should know, ranked by how often we see them in real reader builds.
-
CPU Bottleneck
Most CommonThe processor cannot feed instructions to the GPU fast enough. Your graphics card sits at 50 to 60% usage while the CPU pegs at 95%+. Frame drops in busy scenes are the giveaway.
Full CPU bottleneck guide → -
GPU Bottleneck
Most CommonThe graphics card cannot render frames fast enough for the rest of the system. GPU usage sits at 99% while the CPU has cores to spare. Lowering settings or enabling DLSS / FSR usually fixes it without new hardware.
Full GPU bottleneck guide → -
Memory Bottleneck
CommonToo little RAM or slow RAM. Modern games want 16 GB minimum, 32 GB for comfort. On AMD Ryzen, running DDR5 at stock speeds instead of enabling EXPO costs 10 to 15% performance for free.
Full RAM bottleneck guide → -
Storage Bottleneck
CommonA slow hard drive or SATA SSD where the game expects NVMe. Symptom: long load times, texture pop-in, world streaming hitches in open-world games. Direct Storage games on 2026 hardware demand NVMe Gen4.
How storage affects FPS → -
Thermal Bottleneck
CommonYour CPU or GPU is technically fast enough but overheats under load and throttles itself to cool down. Fresh thermal paste, better airflow, or a stronger cooler usually solves it without buying new silicon.
How to apply thermal paste → -
PSU Bottleneck
Less CommonAn undersized power supply that cannot deliver clean wattage to a hungry RTX 50-series GPU. Symptoms: random crashes under load, sudden shutdowns, GPU never hitting boost clocks. The RTX 5090 alone demands 1000W+ PSUs.
Picking the right PSU → -
Display Bottleneck
Less CommonYour GPU produces 200 FPS but your monitor only refreshes at 60Hz. You see 60 frames and the rest are thrown away. A high-end card on a basic monitor is the silent waste of money no calculator catches.
Monitor refresh rate guide →
Understand How Our PC Bottleneck Calculator Works
The tool has four tabs across the top: Calculator, Compare, Optimal Match and History. Most readers come for the Calculator tab to check a current build, so that is the one I will walk through here. Six inputs, one button, two seconds of compute.
Step 1: Pick your processor brand Click Intel or AMD at the top. The button you choose turns blue.
Step 2: Select your processor model Open the Processor Model dropdown. You will see every recent Intel and AMD chip listed with its current price and core / thread count, like "Intel Core Ultra 9 285K — $589.99 (24C/24T)" or "AMD Ryzen 7 7800X3D." Pick yours.
Do not know your CPU model? Press Windows + R, type dxdiag, press Enter. The processor name appears at the top of the System tab.
Step 3: Pick your graphics card brand NVIDIA, AMD or Intel. Click the one that matches your GPU.
Step 4: Select your graphics card model The Graphics Card Model dropdown lists every modern card with its price and VRAM, like "NVIDIA GeForce RTX 5080 — $1199.99 (16GB VRAM)" or "RTX 5070 — $599.99 (12GB VRAM)." Pick yours.
To find your GPU name, open dxdiag again and click the Display tab. Your card is on the first line.
Step 5: Choose your System RAM 8 GB, 16 GB, 32 GB or 64 GB. Click your total memory. Most modern gaming builds are 16 GB or 32 GB.
Step 6: Set your Display Resolution 1080p, 1440p or 4K. Pick the resolution you actually play at, not your monitor's max. The same hardware gives a very different bottleneck reading at 1080p than at 4K because each resolution stresses your CPU and GPU differently.
Step 7: Choose your Game Type Open the Game Type dropdown and pick the genre you play most: Battle Royale (Warzone, Fortnite), Open World AAA, Esports / Competitive, Strategy / Simulation, MMO, and so on. Each one weighs your CPU and GPU differently. A strategy title leans hard on the CPU. A modern AAA title leans on the GPU. This dropdown changes the result more than people expect.
Step 8: Set Background Load Open the Background Load dropdown. Options range from "Light" (just the game) to "Typical — Browser + Discord" to "Heavy — Streaming / Recording." Be honest. If you stream while gaming, pick the streaming option. The calculator will give you an answer for your real conditions, not a theoretical clean install.
Step 9 (optional but recommended): Open Advanced Options Click ▶ Show Advanced Options. This is where the calculator stops guessing and starts estimating. You can toggle Ray Tracing on or off, DLSS or FSR on or off, set your Detail Level (Low / Medium / High / Ultra), pick a Target FPS (60 / 120 / 144 / 240), and tell it about your cooling and storage.
These are optional. Skip them and the calculator uses sensible defaults. Open them and your result becomes far more specific to your real situation. Ray tracing and DLSS in particular can swing the bottleneck answer by 20 to 50 percentage points on modern hardware.
Step 10: Click Analyze Performance The big blue button at the bottom. Two seconds later the right panel switches from "Ready to analyze" to your full breakdown: bottleneck percentage, the limiting component, severity, estimated FPS for your inputs, and a suggested next step.
If the result shows a real bottleneck, switch over to the Optimal Match tab. It will recommend the cheapest CPU that does not hold your GPU back, or the right GPU for the CPU you already own.
Quick Recap: 10 Steps to Your Bottleneck Result
Two minutes of input, two seconds of compute, one clear answer.
-
1
Pick Processor Brand
Click Intel or AMD at the top.
-
2
Select Processor Model
Choose your CPU from the dropdown showing price + cores / threads.
-
3
Pick GPU Brand
NVIDIA, AMD or Intel. Click the one that matches your card.
-
4
Select GPU Model
Pick your graphics card. Each is listed with current price and VRAM.
-
5
Choose System RAM
8 GB, 16 GB, 32 GB or 64 GB. Pick your total memory.
-
6
Set Display Resolution
1080p, 1440p or 4K. Use what you actually play at.
-
7
Choose Game Type
Battle Royale, Open World, Esports, MMO or whatever you play most.
-
8
Set Background Load
Light, Typical or Heavy. Be honest about what runs alongside your game.
-
9
Open Advanced Options
Toggle Ray Tracing, DLSS / FSR, detail level and target FPS for the most accurate result.
-
10
Click Analyze Performance
Two seconds later you get your bottleneck percentage and what to fix.
Ready to find out what is choking your frames
How to Interpret Your Bottleneck Percentage
The percentage is not a grade, it is a severity rating. Here is how to read it without spiralling into a panic buy. Each tier tells you what the number means and exactly what to do next.
0% to 5% — Perfectly Balanced A practically ideal pairing. Both your CPU and GPU are working at full capacity together. You will not see a single frame lost to imbalance. → What to do: Nothing. Go play.
5% to 10% — Excellent Balance Almost every healthy 2026 build lands here. Minor imbalance is normal because no two components are mathematically perfect for each other. Real-world performance loss is essentially zero. → What to do: Nothing urgent. Enable XMP or EXPO in BIOS if you have not already, for a free 5 to 10% boost on Ryzen systems.
10% to 20% — Mild Bottleneck A real but small imbalance. You may notice FPS drops in CPU-heavy moments like crowded scenes in MMOs, gunfights in battle royale games, or driving sequences in open-world titles. Most users do not feel it day to day. → What to do: Tune in-game settings first. Close background apps. Cap your FPS slightly below your monitor's refresh rate if you are pushing past it. Do not buy hardware yet.
20% to 30% — Moderate Bottleneck A visible problem. Expect frame drops, stutters in demanding scenes, and your stronger component sitting idle while the weaker one redlines. Your build is leaving real performance on the table. → What to do: Plan a targeted upgrade. The calculator names the exact component to replace, and the Optimal Match tab will point you to the right replacement for your budget.
Above 30% — Severe Bottleneck A significant mismatch. One component is bored while the other gasps for air. Your FPS in modern AAA games can be 30 to 50% below what your hardware should deliver in worst cases. This is the tier where ignoring the issue costs you the most money long-term. → What to do: Upgrade the limiting component immediately. The longer you wait, the more frames you lose.
Once you know your tier, the fix is usually clearer than people expect. The next two sections walk you through exactly how to do that, whether the calculator pinned your CPU or your GPU as the limiting part.
How to Find Your Bottleneck with MY Calculator - Real World Example
How to Read Your Bottleneck Score: Three Real Builds
The calculator does more than spit out a number. It tells you whether to relax, tune a few settings, or start saving for an upgrade. Here are three real-world pairings run through the tool, so you know exactly what to look for when you see your own result.
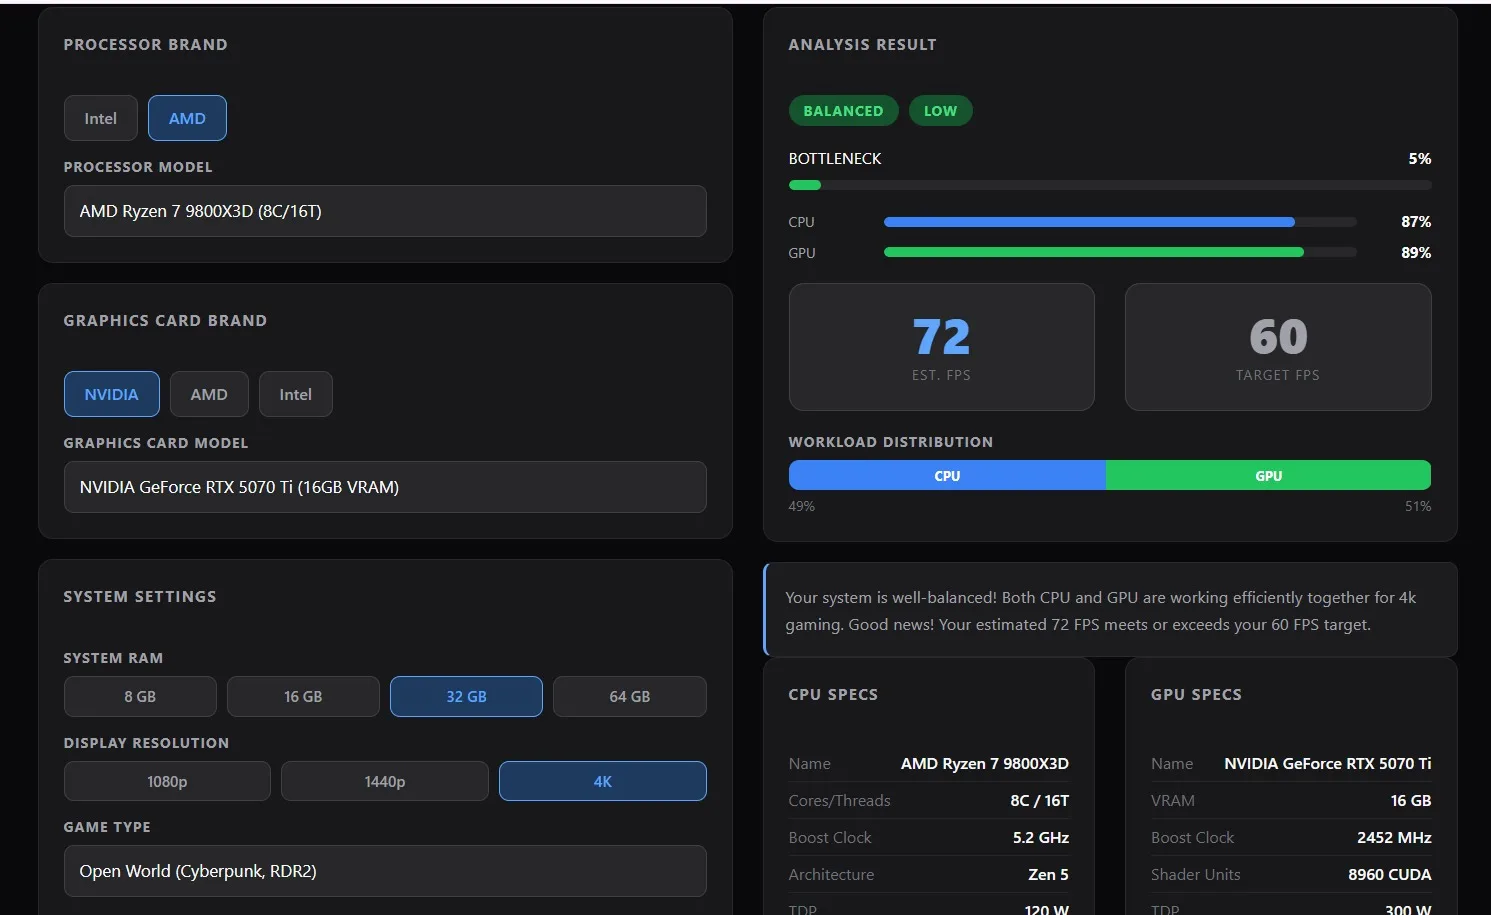
Example 1: Balanced 4K Build, 4% GPU-leaning
Result: A near-perfect 4K pairing. The 9800X3D and RTX 5070 Ti split the load almost evenly, with the GPU pulling 4% more weight than the CPU, exactly what you want at 4K. Estimated 60 to 80 FPS in modern AAA titles with DLSS Quality on.
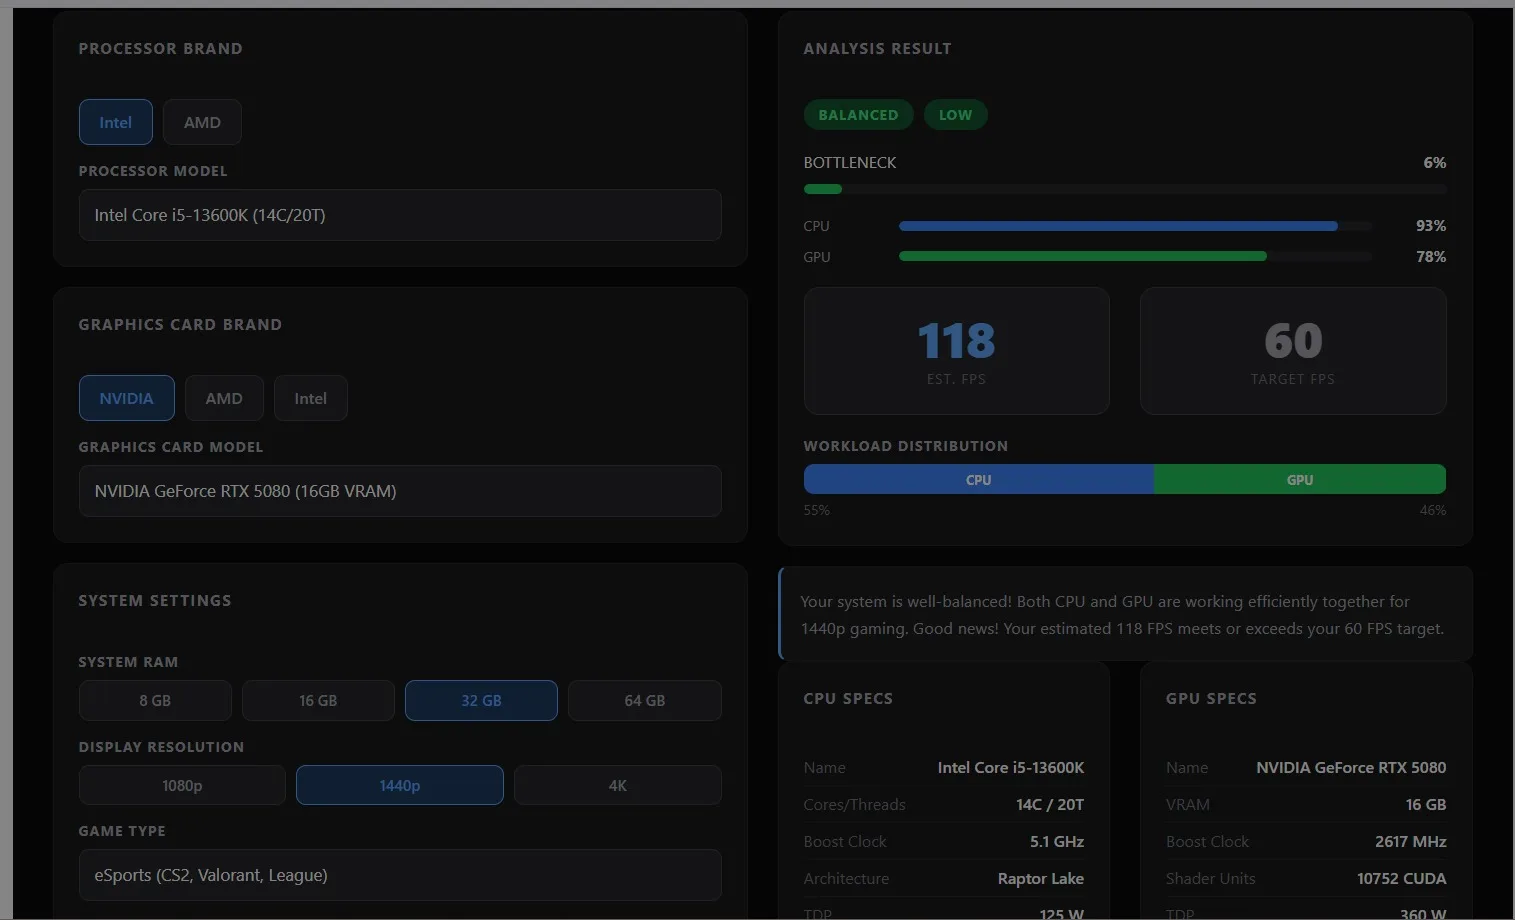
Example 2: A Solid Esports Pairing
Result: 6% CPU bottleneck. The i5-13600K holds its own with the RTX 5080 in most esports titles, but starts losing ground in CPU-heavy scenarios where the GPU has more frames to give than the CPU can prepare. A mild gap. Playable, but leaving a little performance on the table.
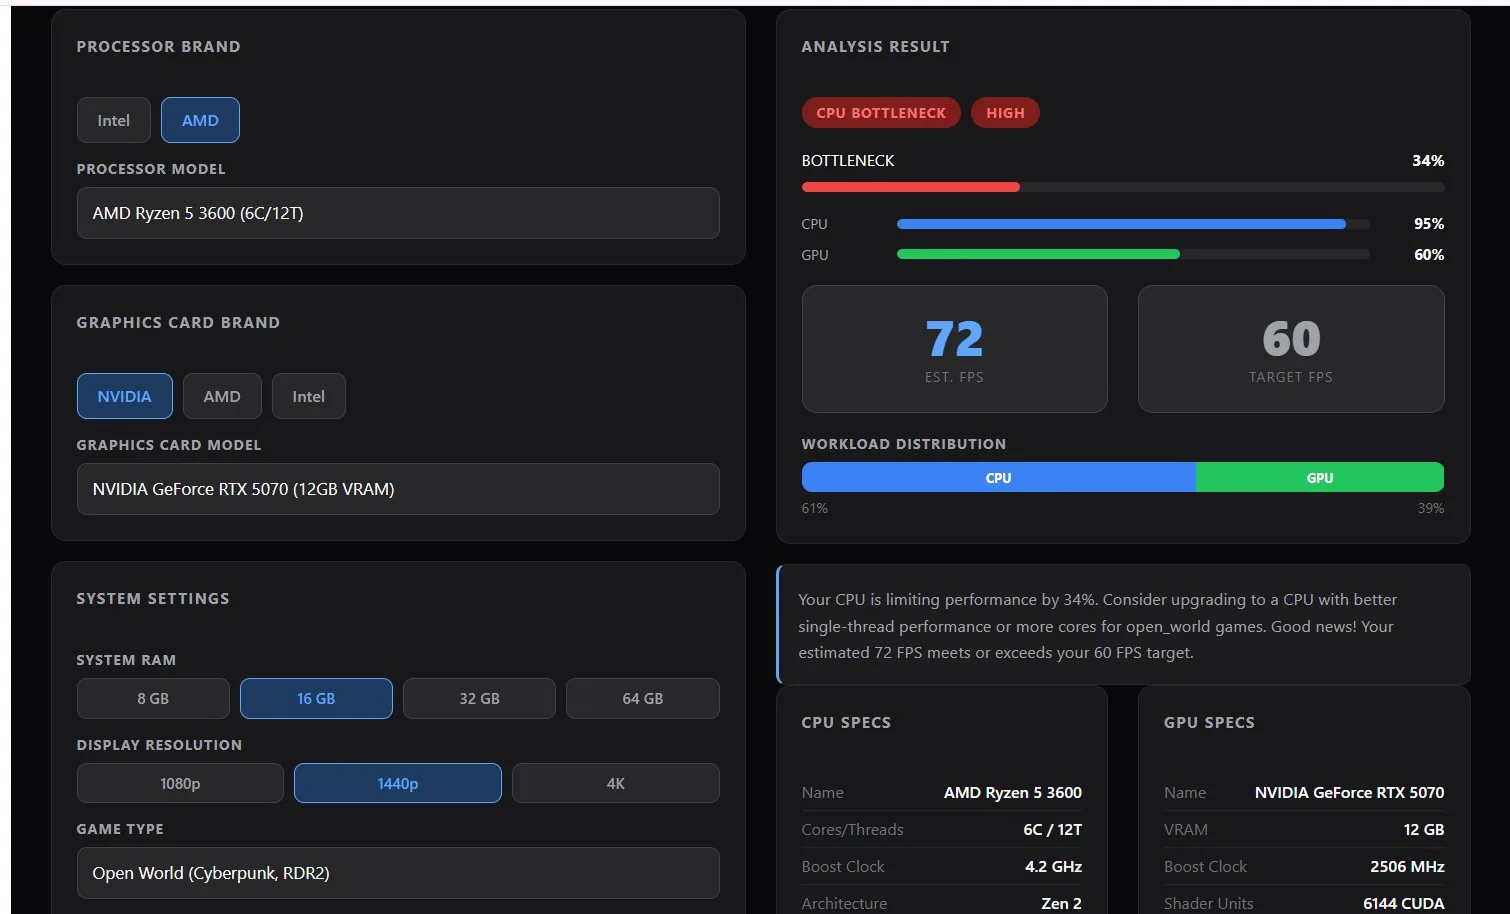
Example 3: The Common Upgrade Trap
Result: 34% severe CPU bottleneck. This is the pairing we see most often from readers who upgraded the GPU without touching the CPU. The RTX 5070 sits at 50 to 60% usage while the Ryzen 5 3600 redlines, costing roughly half the frames the new card should deliver.
How to Use the Compare Components Section to Upgrade Your System
The Compare tab is the second of the three tabs at the top of the calculator. Use it when you have already narrowed your choice down to two specific parts and need a tiebreaker. The Calculator tab tells you what to upgrade. The Compare tab tells you which option to buy.
When to use Compare vs Optimal Match
- Use the Calculator tab when you want to know if your current build has a bottleneck.
- Use the Compare tab when you have already picked two candidates and want to see which one performs better for your use case.
- Use the Optimal Match tab when you know one component and need the calculator to suggest the right partner.
Most readers run the Calculator first, then use Compare to decide between two final options. That is the workflow this tab is built for.
Comparing two CPUs
Drop two processors into the Compare tab to see them side by side on cores, threads, single-thread performance, base and boost clocks, cache size, and gaming benchmarks at your chosen resolution.
A few real comparisons readers run most often:
- Ryzen 7 vs Core i5 for mid-range gaming builds
- Ryzen 7 vs Core i7 when budget allows the next tier up
- Ryzen 9 vs Core i9 for high-end and content creation setups
- Ryzen 7 7800X3D vs Ryzen 7 9800X3D for the 2026 gaming flagship question
The single-thread score is the number that matters most for gaming. Multi-core scores matter more for streaming, video editing and 3D rendering.
Comparing two GPUs
Drop two graphics cards into the Compare tab and you get VRAM capacity, ray tracing performance, DLSS or FSR support, power draw, and estimated FPS at your selected resolution and game type.
Real comparisons worth running:
- NVIDIA vs AMD at the same price tier
- RTX 5070 vs RTX 5070 Ti for the 1440p sweet spot decision
- RTX 5080 vs RX 9070 XT for the upper mid-range
- NVIDIA vs Intel Arc for budget builds where ray tracing matters less
For pure 1440p gaming, focus on the FPS estimate column. For 4K or ray-traced gaming, prioritize the VRAM and ray tracing columns. For streaming, the encoder type (NVENC on NVIDIA, AMF on AMD) matters more than raw FPS.
Quick workflow example
Say the Calculator tab told you to upgrade your GPU. You have narrowed your shortlist to an RTX 5070 ($599) and an RTX 5070 Ti ($799). Open the Compare tab. Drop both cards in. Set your resolution to 1440p. Pick your game type. The tab returns the expected FPS difference, the VRAM gap (12 GB vs 16 GB), and the ray tracing performance delta. If the FPS gap is under 15%, the cheaper card is the smart buy. If it's over 25%, the Ti earns its premium.
That is the entire decision in 60 seconds, made on data instead of YouTube opinion.
Find Optimal Component Match to Fix Your System Bottleneck
The Optimal Match tab is the third of the three tabs at the top of the calculator. This is the tab that closes the loop. The Calculator tab finds the bottleneck. The Compare tab helps you decide between two specific options. The Optimal Match tab does the harder job, which is naming the right replacement when you do not already have a shortlist.
Most readers come here after the Calculator flags a problem. Instead of opening 20 browser tabs comparing reviews, the Optimal Match tab returns three answers based on the component you keep.
Find CPU for My GPU
You already own a graphics card. The calculator tells you it's being held back by your processor. Open this section, plug in the GPU you have, and the tool returns:
- The cheapest CPU that does not bottleneck your card
- The best-value CPU for your GPU's tier (typically the smart-money pick)
- The flagship CPU if you want maximum headroom for future upgrades
For a current RTX 5070, the recommendations land around the Ryzen 5 7600 (budget), Ryzen 7 7700X (value), and Ryzen 7 9800X3D (flagship). For an RTX 5090, the budget pick disappears entirely because the card demands a top-tier CPU to be fed properly.
Find GPU for My CPU
You already own a processor, maybe from an upgrade two or three years ago, and now you're shopping for a graphics card. Plug in your CPU and the tool returns three GPU options at different price tiers, each guaranteed not to be capped by your processor.
This is the section that saves the most money in real reader builds. The reflex is to buy the most powerful GPU you can afford. The smarter move is to buy the most powerful GPU your CPU can actually feed. A Ryzen 5 5600 cannot feed an RTX 5080. Spending $1000 on the GPU when your CPU caps it at RTX 5070 performance is throwing $400 in the bin.
Use the budget filters
Both Optimal Match modes include advanced filters to narrow recommendations to your real budget. Set a price ceiling. Filter by brand (NVIDIA only, AMD only, Intel only). Filter by VRAM minimum if you're targeting 4K gaming. The tool will not recommend something you cannot afford.
Workflow example
Calculator tab flagged a 28% CPU bottleneck on your old Ryzen 5 3600 paired with a new RTX 5070. You open the Optimal Match tab, select "Find CPU for My GPU," plug in the RTX 5070, set your budget filter to $300. The tab returns the Ryzen 5 7600 ($229) as the budget pick and the Ryzen 7 7700X ($299) as the value pick. Both resolve the bottleneck. The choice is now between $70 and a noticeable performance bump, not between 47 different processors on Newegg.
That's the entire decision compressed from a week of research into 90 seconds.
How to Fix Bottlenecks Without Upgrading Hardware
Fix Without Upgrading — Try These First
If your bottleneck percentage is somewhere between 10% and 30%, you do not necessarily need to spend money on new hardware. There are several things you can try first to reduce the bottleneck and improve your performance:
Update your drivers: Outdated GPU or chipset drivers can cause performance issues that look like a bottleneck but are simply a software problem
Close background processes: This is the first step you can take to improve your system’s performance, and many of you have probably already done it before running a bottleneck test.
Overclock your CPU: You can overclock your CPU to remove any mild to moderate CPU bottleneck. But be aware that no thermal throttling hits your system. Learn how you can properly do overclocking CPU without damaging your hardware or losing system stability.
Overclock your GPU: Similarly, a mild GPU overclock can help close the performance gap if your GPU is the limiting factor. You can follow our detailed how to overclock GPU guide to do it safely and get the most out of your card without risking stability. Moreover, you can enable Hardware Accelerated GPU Scheduling (HAGS) if you are already using an efficient GPU, then you can use this Windows feature to remove any CPU bottleneck.
Increase your in-game resolution: Another way to fix a CPU bottleneck is to increase the resolution, which shifts some of the workload to the more efficient GPU and helps balance the performance between your components. Make sure your GPU is efficient enough to prevent the resolution bottleneck.
When You Should Consider Upgrading
If your bottleneck percentage is above 30%, the methods above may offer only minor improvements. At this level, the mismatch between your CPU and GPU is significant enough that an upgrade is the most effective solution:
- CPU is the bottleneck — Upgrade to a faster processor that better matches your GPU's capability
- GPU is the bottleneck — Invest in a more powerful graphics card
- Also, check your RAM — Slow or insufficient RAM can contribute to bottlenecks and a RAM upgrade is often cheaper than replacing a CPU or GPU. We tested every major kit in our best RAM for gaming guide so you know exactly what to buy without guessing.
- Before spending anything, run a free benchmark first to see exactly where your system stands. Our best free PC benchmark software guide covers the top tools so you can verify the bottleneck with real data before making any decisions.
How Ray Tracing and DLSS Affect Your Bottleneck
Ray tracing (RT) makes lighting, shadows, and reflections look more real, but it heavily lowers FPS. In many games, FPS can drop by 30–70%.
DLSS, FSR, and XeSS help recover FPS by rendering at a lower resolution and scaling the image up with AI. DLSS Quality can recover 30–60% of lost FPS, while Frame Generation on newer GPUs can boost FPS even more.
These settings also change your bottleneck.
Scenario 1 — 1080p, RT Off, DLSS Off
The GPU becomes too fast for the CPU.
CPU usage hits 100% while GPU usage drops.
This creates a CPU bottleneck, common in esports games at high FPS.
Scenario 2 — 1440p/4K, RT On, DLSS On
Both CPU and GPU work harder together.
The GPU handles RT and upscaling, while the CPU handles extra game data and draw calls.
This usually creates a more balanced system.
Many bottleneck calculators ignore RT and DLSS, so their results are inaccurate. A modern calculator should test RT, DLSS/FSR, resolution, and target FPS together.
Real Example — AMD Ryzen 7 7800X3D + NVIDIA GeForce RTX 5070 Ti in Cyberpunk 2077 at 1440p
| Settings | FPS | Result |
|---|---|---|
| RT Off, DLSS Off | 110–140 | Balanced |
| RT Ultra, DLSS Off | 50–70 | GPU bottleneck |
| RT Ultra, DLSS Quality | 90–120 | Low bottleneck |
| RT Ultra + Frame Gen | 130–180 | Mild CPU bottleneck |
Same hardware, different settings, completely different bottlenecks.
Why This Bottleneck Calculator Is Different
Most online bottleneck calculators were built for a simpler era of PC hardware. They ask for a CPU, a GPU, maybe a resolution, and call it a diagnosis. In 2026 that approach is broken, because DLSS, ray tracing, RAM speed, target FPS, and game type now move the answer by 20 to 50 percentage points each. A calculator that ignores them returns a number that looks precise and means almost nothing.
Here is exactly where our calculator differs from the older tools, and why those differences matter for the result you get.
1. It factors DLSS, FSR and Frame Generation
Most calculators assume native rendering. Turn DLSS Quality on with a 2026 RTX card and your effective GPU horsepower jumps 30 to 60%. Multi Frame Generation on RTX 50-series can quadruple your FPS. A "GPU bottleneck" at native 4K can flip to a CPU bottleneck the moment upscaling is enabled. The calculator accounts for this. Most do not.
2. It includes ray tracing in the math
Ray tracing is the single most expensive setting in modern games, costing 30 to 70% of your frame rate. A calculator that ignores RT cannot tell you whether your GPU is actually the limiting part in your real game settings. The calculator asks, and weights the result accordingly.
3. It factors RAM speed and capacity
On AMD Ryzen, running DDR5 at JEDEC defaults instead of EXPO speeds shifts your bottleneck score by 10 to 15 percentage points. Single-channel RAM costs up to 25%. Most calculators skip RAM entirely. The calculator includes it.
4. It asks for your real game type
A strategy game leans on the CPU. An open-world AAA leans on the GPU. An esports title leans on both at high refresh rates. The calculator weighs your components against the games you actually play, not a generic "gaming" workload that means nothing.
5. It targets your specific FPS goal
A balanced build for 60 FPS at 4K is wildly different from one for 240 FPS at 1080p. The calculator asks which one you want, then judges your hardware against that goal. Most calculators answer the same way regardless of whether you're casual gaming or competitive.
6. It suggests the fix, not just the problem
When the result is bad, the Optimal Match tab names the cheapest CPU that resolves the bottleneck, the value pick, and the flagship pick. With budget filters built in. Most calculators stop at telling you something is wrong and leave you to figure out the fix on Newegg.
FAQs
What level of bottleneck is bad?
Under 10% is excellent and normal for any healthy build. From 10 to 20% is mild and usually fixable without new hardware. From 20 to 30% is a real problem worth a targeted upgrade. Above 30% is severe and should be fixed immediately.
Should I upgrade my CPU or GPU first?
Upgrade the one the calculator names as the bottleneck. For pure gaming, a stronger GPU usually delivers more frames per dollar, but only if your CPU is not already capping it. Then open Task Manager during a real gaming session, go to the Performance tab, and watch your CPU and GPU usage live. If your CPU sits at 95%+ while the GPU is below 90%, the CPU is the bottleneck. If the GPU is pinned at 99% while the CPU has spare cores, the GPU is the bottleneck.
Does bottlenecking damage my PC or cause overheating?
No. A bottleneck is a performance issue, not a hardware risk. One part sits idle while the other works, but neither is being pushed beyond its limits. Even thermal bottlenecks, where a chip throttles to cool down, do not damage modern hardware because CPUs and GPUs automatically slow themselves before reaching dangerous temperatures. There is no heat damage, no electrical risk, nothing to worry about long-term. The only cost is the frames you are not getting.
Why is my GPU at 50% usage in games?
That is the textbook signature of a CPU bottleneck. Your processor cannot feed instructions to the GPU fast enough, so the graphics card waits with nothing to do. The answer is almost certainly a CPU upgrade or, in milder cases, closing background apps and updating drivers.
Are Bottleneck Calculators Accurate?
No tool that does not physically sit inside your PC can be 100% accurate. Real-world results vary with drivers, specific game engines, background apps, thermal conditions and BIOS settings. Treat any calculator as 85 to 95% accurate for component ratios. For verification, pair it with five minutes of MSI Afterburner monitoring during a real game session.
Final Words
Our calculator was built for 2026 hardware and real gaming conditions. If you find something that does not match your experience, we want to know. Drop a comment below. We designed it after checking all the current tools that missed key points and couldn’t deliver reliable results. Our trusted bottleneck calculator tool is compact and easy to use. Select the calculator tab to check your system’s bottleneck, the Compare tab to compare two CPUs or GPUs to see which one is the smarter choice to buy, and the Find Match tab to find the perfect CPU-GPU combo for your setup.
If you have any ideas to make our tool better, hit us up; we’re always down to hear what our users think.
Also available as a free Android app, search My PC Bottleneck Calculator on Google Play.
Popular GPU Comparisons
See how today's most-searched GPUs stack up, backed by real bottleneck calculator data
RTX 4060 vs RTX 5060
Full FPS and bottleneck breakdown to see if the upgrade is worth it for your CPU setup.
Full guide →RTX 5080 vs RTX 5090
High-end face-off for 4K gamers deciding between flagship and near-flagship performance.
Full guide →RX 9070 vs RTX 5070
AMD vs Nvidia mid-tier matchup, broken down by real gaming bottleneck percentages.
Full guide →RTX 5060 vs RTX 4070
Same-tier naming, different performance class. See which GPU actually wins for gaming.
Full guide →RTX 5070 vs RTX 5070 Ti
The Ti tax explained. Full benchmarks to see if the upgrade is actually worth paying for.
Full guide →RTX 5060 vs RTX 5060 Ti
Same generation, different tier. See how much extra FPS the Ti actually delivers.
Full guide →RX 9060 XT vs RTX 5060 Ti
Budget-tier AMD vs Nvidia battle, compared head to head with real bottleneck benchmarks.
Full guide →Ryzen 7 9800X3D vs 9700X
Two popular Ryzen 7 chips tested across dozens of GPU pairings to find the better balanced build.
Full guide →Discover More
Simple PC Bottleneck Terms Explained
1. Bottleneck – The part of your PC that slows everything down.
2. Bottleneck Calculator – A tool that tells which part of your PC is causing slow performance.
3. Thermal Bottleneck – When your PC overheats and slows down to cool itself.
4. FPS (Frames Per Second) – How smooth your game looks. Higher FPS = smoother gameplay.
5. DLSS / FSR – Smart settings that make games run faster without losing much quality.
6. Ray Tracing – Makes lighting and shadows look real but uses more GPU power.
7. Thermal Throttling – When your PC slows down because it’s too hot.
